Graphing Slope
Enhanced Slope Visualization with Practice Mode
Interactive slope visualization with dynamic scaling and navigation:
- Use zoom controls, mouse wheel, or pinch gestures to zoom in/out
- Click and drag or use touch gestures to pan around the coordinate plane
- The grid automatically adjusts based on your input values
Tip: Enter slope as a fraction (3/2) or decimal (1.5)
Step 1: Plot the starting point
Current scale: 1 unit per grid
Graphing slope is the goal of this lesson. We will show you here how easy the process is using the slope and any point given.
A couple of examples showing how graphing slope works
Example #1:
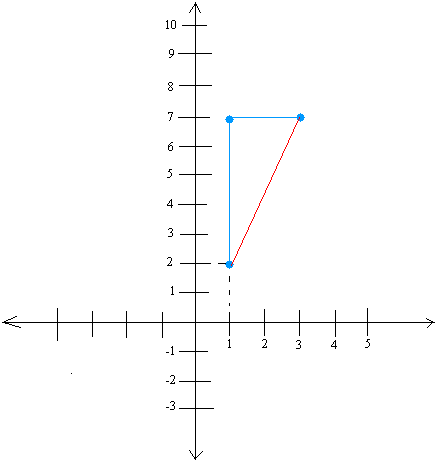
Given a point of (1, 2) and a slope of 5/2, graph the slope of the line.
First, we need to locate the point (1, 2) and put it on the coordinate system.
We show the point (1, 2) with a blue dot in the figure below.
Then, from that point, you will need to show a slope of 5/2
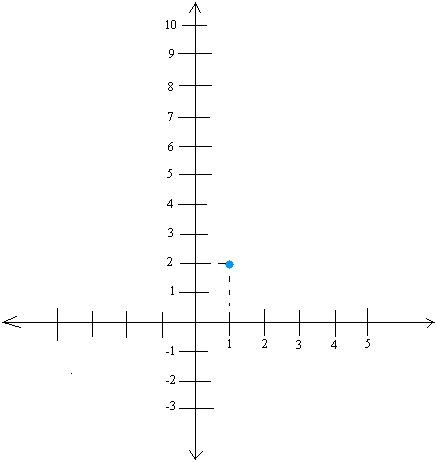
Using the slope of 5/2, we see that 5 is the rise and 2 is the run or horizontal distance.
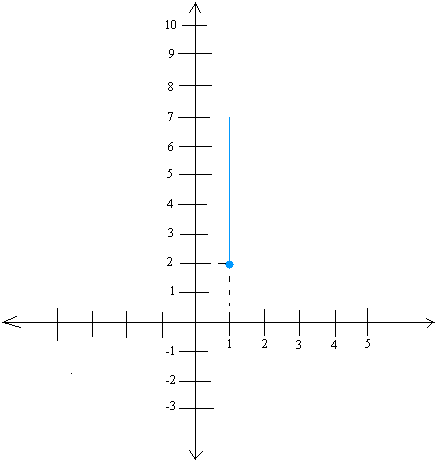
Now, starting at the point (1,2) or the blue dot, draw a rise of 5. In other words, count 5 units straight up as you draw a line. You will end up at the point (1,7) after you are done.
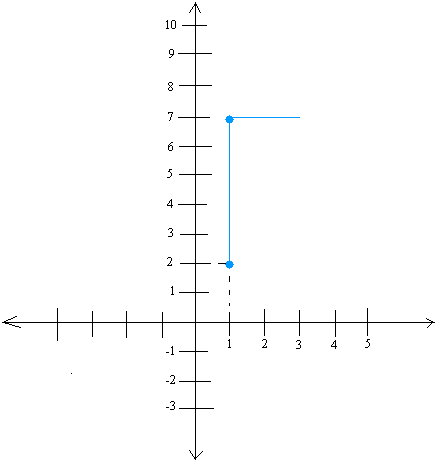
Now, starting at point (1,7), draw a run of 2 or count 2 units horizontally as you draw a line. You will end up at the point (3,7) once you are done doing this.
Recall that when drawing the run, you will always move from left to right.
Finally, draw a line between your starting point and your final point. This is the slope of the line, which we show below with a red line.
Example #2:
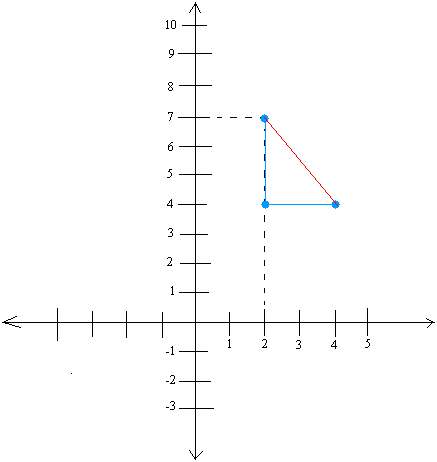
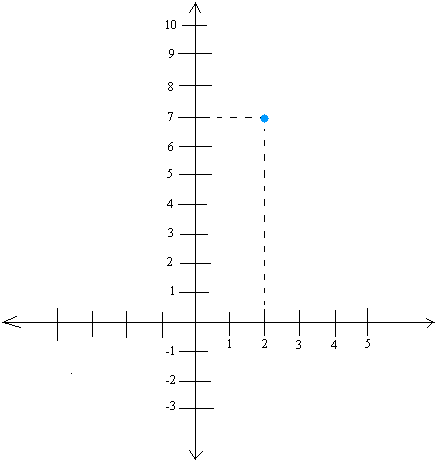
Given a point of (2, 7) and a slope of -3/2, graph the slope of the line.
First, locate the point (2, 7) and put it on the coordinate system.
Using the slope of -3/2, we see that 3 is the fall and 2 is the run or horizontal distance.
Notice that this time we don't rise, but fall because the slope is negative.
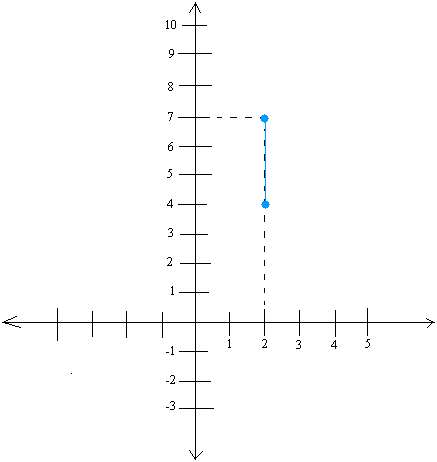
Now, starting at the point (2,7) draw a fall of 3. In other words, count 3 units straight down as you draw a line. Once you are done, you will end point at the point (2, 4).
Starting at point (2,4), draw a run of 2 or count 2 units horizontally as you draw a line. Once you are done, you will end up at the point (4,4)
Again, when drawing the run, you will always move from left to right.
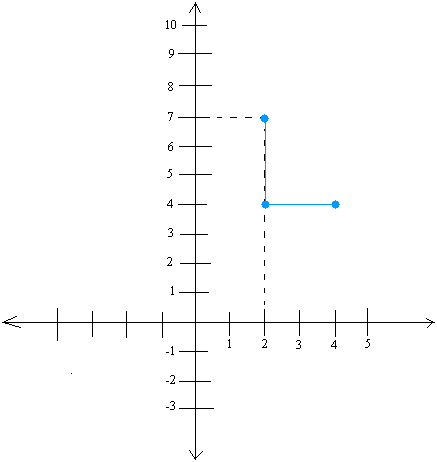
Finally, draw a line between your starting point and your final point. This is the slope of the line.
