Measures of central tendency 

The measures of central tendency are the mean, median and mode of a set of data. Although looking at graphs such as bar charts or histograms is very useful to analyze data, it is not enough in many cases in order to draw meaningful conclusions.

We also need measures of central tendencymeasures of variation, and measures of position.

A measure of center is the value in the middle of a data set. This value in the middle is also called average. To find the average, you can look for the mean, the median, the mode, or the midrange.
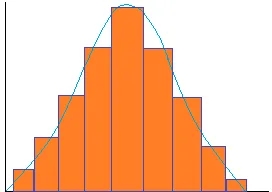
Measures of central tendencyMeasures of central tendency

The measure of variation refers to how close the values are to each other. The standard deviation and Chebyshev’s theorem are used a lot to find measures of variation.

The measure of position determines the position of a single value in relation to other values in the data set. Some measures of position are quartiles, deciles, percentiles, percentile rank, and z scores.
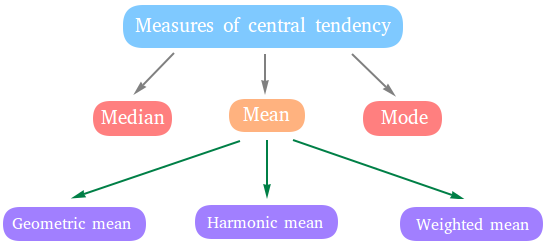
Check the lessons below to learn more about measures of central tendency 

Measures of central tendency

Finding the average
Check this lesson to practice finding the average, also called arithmetic mean or simply mean.

Average calculator
Enter your numbers and this calculator will easily help you find the mean or the average.

Arithmetic mean in statistics
What is the arithmetic mean? Definition, formula, and examples in statistics

Mean from a frequency table
Learn to find the mean from a frequency table when you don't know the exact values in the classes.

Mode of a set of data
Practice a little more with this lesson about finding the mode. 

Mode calculator
This calculator will find the mode of a set of numbers.

Finding the median
The median is the value in the middle when the set is ordered from least to greatest or from greatest to least. Learn more with this lesson.

Finding the median using a diagram or a formula

Median calculator
This calculator will find the median of a set of numbers.

Midrange of a data set
What is the midrange of a data set? Definition and examples

Stem and leaf plot
Learn how to organize data with a stem and leaf plot

Best measure of center
What is the best measure of center?Learn if you should use the arithmetic mean, the median, the mode, or the midrange for your statistical data.

Relationship between the mean, median and mode
What is the relationship between the mean, median, and mode?

Types of averages
Learn about the different types of averages

Difference between parameter and statistics
Should I use µ and σ or s and x? 

Should I use µ and σ or s and x?

Other lessons related to measures of measures of tendency: measures of dispersion

Measures of dispersion
What are measures of dispersion? Explanations and examples.

Standard deviation
What is standard deviation? Crystal clear explanation of what the standard deviation is. Learn to calculate it and understand how the formula was derived.

Standard deviation formula
Lesson on how to find the standard deviation using the formula.

Variance and standard deviation for grouped data
Learn how to find the variance and standard deviation for grouped data

Standard deviation problems
Solution to some interesting standard deviation word problems.

Standard deviation calculator
This calculator will compute the standard deviation of a set of numbers.

Chebyshev's Theorem
Learn how to use the mean and the standard deviation to find the percentage of the total observations that fall within a given interval about the mean.

Empirical Rule
Learn how to use the empirical rule to find the percentage of the total observations that fall within a given interval about the mean.

Measures of position

Box and whiskers plot
Learn how to construct a box and whiskers plot for a set of data using the median.

Quartiles and interquartile range
Definition and examples of quartiles and interquartile range

Percentiles and percentile rank
Definition, formula, and examples of percentiles and percentile rank

Mean: The mean is the sum of the values in the set divided by the number of items in the set. There is basically no difference between the mean, the arithmetic mean, and the average. In statistics, the term 'mean' is used instead of 'average'

For example, what is the mean for 2, 4, and 6?

(2 + 4 + 6)/3 = 12/3

(2 + 4 + 6)/3 = 4

Mode: The mode of a set of data is the value or values that occur more often.

For example, the mode of 6, 5, 2, 3, 5, 1, 8 is 5 because 5 appears more often than the other values.

Median: The median of an ordered set of data is the value in the middle.

For example, the median of 4, 6, 8, 10, 12 is 8 since 8 is the value in the middle.


Tough algebra word problems

100 Tough Algebra Word Problems.

If you can solve these problems with no help, you must be a genius!

Math quizzes

 Recommended