3 Circle Venn Diagram
A 3 circle Venn diagram, named after the English logician Robert Venn, is a diagram that shows how the elements of three sets are related using three overlapping circles.
When the three circles in a Venn diagram overlap, the overlapping parts contain elements that are common to any two circles or all the three circles.
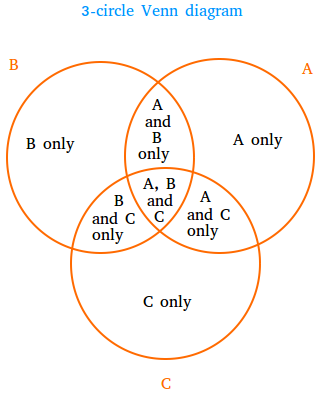
How to understand the overlaps in a 3 circle Venn diagram
Let’s consider three sets A, B, and C and their corresponding circles:
Set A: Students who play ping pong.
Set B: Students who play soccer.
Set C: Students who play basketball.
Non-Overlapping Sections:
These represent elements that are unique to just one set. For example, students who only play ping pong would fall into the non-overlapping part of circle A.
Two-Circle Overlaps:
These represent elements that are common to two sets but not the third set. For example, the overlap between circles A and B would represent students who play both ping pong and soccer but not basketball
Three-Circle Overlap:
These represent elements common to all three sets. In our example, this would be students who play ping pong, soccer, and basketball.
Some important observations
- Elements in A and B = elements in A and B only plus elements in A, B, and C.
- Elements in B and C = elements in B and C only plus elements in A, B, and C.
- Elements in A and C = elements in A and C only plus elements in A, B, and C.
Example showing how to create a 3 circle Venn diagram
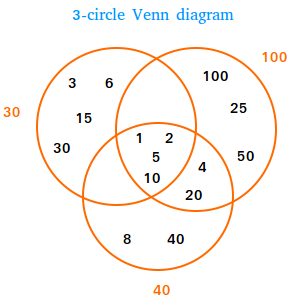
We can create a 3-circle Venn diagram to show the relationships between the factors of 30, 40, and 100.
Factors of 30: 1, 2, 3, 5, 6, 10, 15, 30
Factors of 40: 1, 2, 4, 5, 8, 10, 20, 40
Factors of 100: 1, 2, 4, 5, 10, 20, 25, 50, 100

Non-Overlapping Sections:
Factors of 30: 3, 6, 15, 30
Factors of 40: 8, 40
Factors of 100: 25, 50, 100
Two-Circle Overlaps:
Factors of 30 ∩ Factors of 40: {}
Factors of 30 ∩ Factors of 100: {}
Factors of 40 ∩ Factors of 100: {4, 20}
Three-Circle Overlaps:
Factors of 30 ∩ Factors of 40 ∩ Factors of 100: {1, 2, 5, 10}
