Box and whiskers plot
A box and whiskers plot, also called box plot, is a graph that summarizes of set of data along a number line from least to greatest in order to show how data items are spread out. Before studying this lesson about box plot, you may need to understand what the median is.
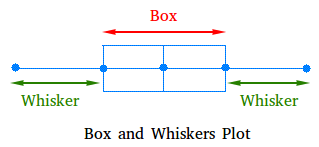
Basically a box and whiskers plot looks like the graph you see below. Just like the name suggests, a box plot has two main components, a box in the middle and whiskers at either side.

Now the reason we call the two lines extending from the edge of the box "whiskers" is simply because they look like whiskers or mustache, especially mustache of a cat.
The five parts of a box and whiskers plot
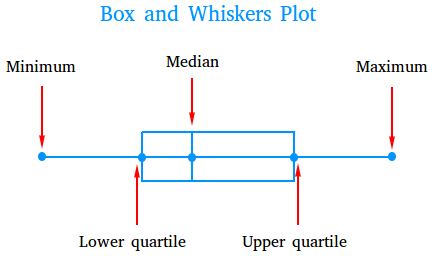
The five points or dot that you see in the figure represent the five parts of a box and whiskers plot and these parts are minimum, lower quartile, median, uppper quartile, and maximum.

- The minimum, also called the lower extreme is the lowest value or smallest value in a set of data.
- The lower quartile, also called the first quartile or Q1, is the median of all data below the median. The lower quartile could also be called the median of the lower half.
- The median, also called the second quartile or Q2 is the middle value of the set of data. If there are two values in the middle, the median is the average of the two values. The median could also be called the middle quartile.
- The upper quartile, also called the third quartile or Q3 is the median of all data above the median. The upper quartile could also be called the median of the upper half.
- The maximum, also called the upper extreme, is the highest value in a set of data.
Definition of some useful terms
Interquartile range
The interquartile range (IQR) is the difference between the third quartile and the first quartile.
Interquartile range = Q3 - Q1
Lower inner fence
The lower inner fence is the point that is 1.5 × IQR below the first quartile or Q1.
Lower outer fence
The lower outer fence is the point that is 3 × IQR below the first quartile or Q1.
Upper inner fence
The upper inner fence is the point that is 1.5 × IQR above the third quartile Q3.
Upper outer fence
The upper outer fence is the point that is 3 × IQR above the third quartile or Q3.
Outliers or extreme values
Values that are either very big or very small in comparison with the majority of the values in a set of data are called outliers or extreme values. We use an asterisk to show this on the box and whiskers plot.
If a value is outside either of the two inner fences, but within the two outer fences, this value is a mild outlier.
If a value is outside either of the two outer fences, this value is an extreme outlier.
How to make a box and whiskers plot
Follow the five steps below to construct or make a box and whisker plot
- Put the data in increasing order and then calculate the median, the first quartile, the third quartile, and the interquartile range.
- Create the box with the first quartile, the median, and the third quartile. Inside the box, draw also a vertical line at the position of the median.
- Find the lower and the upper inner fences and if necessary the lower and the upper outer fences.
- Find the smallest and biggest values in the data set that are within the lower and the upper inner fences.
- Use the smallest and biggest values to draw the whiskers. Then, show any outliers or values that falls outside the two inner fences with an asterisk.
An example showing how to create a box and whiskers plot
Example #1
Construct a box and whiskers plot for the data set: {5, 2, 16, 9, 13, 7, 10}
Step 1
First, you have to put the data set in order from least to greatest.
From least to greatest we get: 2 5 7 9 10 13 16
Carefully looking at the set we see that 9 is located right in the middle of the set of data.
Therefore, 9 is the median.
Now to get the first quartile, you need all data before the median or 9.
2 5 7 9 10 13 16
In red right above we show all data before 9, so 2 5 7
Since the value in the middle of the set 2 5 7 is 5, the first quartile or Q1 is 5.
To get the third quartile, you need all data after the median or 9.
2 5 7 9 10 13 16
In red right above we show all data after 9, so 10 13 16
Since the value in the middle of the set 10 13 16 is 13, the third quartile or Q3 is 13.
Find the interquartile range (IQR)
IQR = 13 - 5 = 8
Step 2
Create the box with with the first quartile, the median, and the third quartile. Inside the box, draw also a vertical line at the position of the median.

Step 3
Find the lower and upper inner fences.
1.5 × IQR = 1.5 × 8 = 12
Lower inner fence = 5 - 12 = -7
Upper inner fence = 13 + 12 = 25
Step 4
Notice 2 is bigger than -7 and 16 is smaller than 25. The smallest and biggest values in the data set that are within the lower and the upper inner fences are 2 and 16 respectively. Therefore, the minimum is 2 and the maximum is 16.
Step 5
Use the smallest and biggest values to add the whiskers.

Finally, draw horizontal segments or whiskers that connect all five dots together. Your graph should look like this after you are done. The box and whiskers plot for {5, 2, 16, 9, 13, 7, 10} is the graph below.

How to create a box and whiskers plot with outliers
Example #2
Construct a box and whiskers plot for the data set: {5, 26, 2, 1, 9, 13, 7, 10, 17, 8, 12}
Step 1
First, you have to put the data set in order from least to greatest.
From least to greatest we get:
1 2 5 7 8 9 10 12 13 17 26
The median is 9, the first quartile is 5, and the third quartile is 13.
IQR = 13 - 5 = 8
Step 2
Create a box by putting the median, the first quartile, and the third quartile on the number line just like it was done earlier.

Step 3
Find the lower and upper inner fences.
1.5 × IQR = 1.5 × 8 = 12
Lower inner fence = 5 - 12 = -7
Upper inner fence = 13 + 12 = 25
Step 4
Notice 1 is bigger than -7 and 17 is smaller than 25. The smallest and biggest values in the data set that are within the lower and the upper inner fences are 1 and 17 respectively. Therefore, the lowest number is 1 and highest number is 17.
Step 5
Use the smallest and biggest values to add the whiskers.

The upper inner fence is 25. Thus, 26 is an outlier since it is bigger than the upper inner fence. Finally, draw horizontal segments or whiskers that connect all five dots together. Show the outlier with an asterisk.
You can clearly see that 26 is far greater than the other values of the data set. Your graph should look like the one you see below after you are done.
