Find the z-scores for a specified area
Finding the z-scores for a specified area is the reverse procedure of finding the area under the normal curve. You will again need the standard normal distribution table.
Example #1
Find a point z such that the area under the standard normal curve between 0 and z is 0.3749 and the value of z is positive.
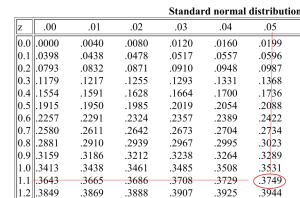
Use the standard normal distribution table to locate 0.3749. Next read the numbers in the column and row for z, which correspond to 0.3749.

As you can see these numbers are 1.1 and 0.05. Just add these numbers to get z.
z = 1.1 + 0.05 = 1.5
Example #2
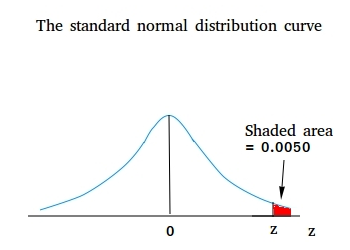
Find a point z such that the area under the standard normal curve in the right tail is 0.0050 and the value of z is positive.
Recall that the right tail refers to the area to the right of z. What we need to find though is the area between 0 and z.

The total area to the right of z = 0 is 0.5.
Therefore, area between 0 and z = 0.5 - 0.0050 = 0.495.
Use the standard normal distribution table to locate 0.495. After looking carefully to locate 0.495, you will probably realize that 0.495 is not on the table. In this case, you can use the value closest to 0.495.
Either 0.4949 or 0.4951 is closest to 0.495 since 0.495 is right in the middle of these two values.
You can just use either of these two values. Say you choose 0.4949.
Next read the numbers in the column and row for z, which correspond to 0.4949.
As you can see these numbers are 2.5 and 0.07. Just add these numbers to get z.
z = 2.5 + 0.07 = 2.57