Frequency distribution of quantitative data
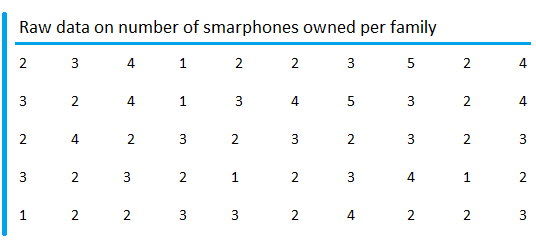
In order to find the frequency distribution of quantitative data, we can use the following table that gives information about "the number of smartphones owned per family."

For such quantitative data, it is quite straightforward to make a frequency distribution table.
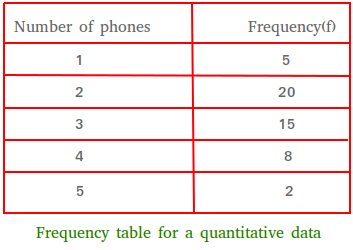
People either own 1, 2, 3, 4, or 5 smartphones. Then, all you need to do is to find the frequency of 1, 2, 3, 4, and 5.
The frequency of 1 is 5.
The frequency of 2 is 20.
The frequency of 3 is 15
The frequency of 4 is 8
The frequency of 5 is 2
Finally, just put the information in a table.

As you can see, there 5 groups (1, 2, 3, 4, and 5). To be more precise we prefer to say 5 classes.
Group is the name that we use for qualitative data.
It is not wrong to have less than 5 classes. However, usually the least number of classes is 5 and we like to use intervals for those classes.
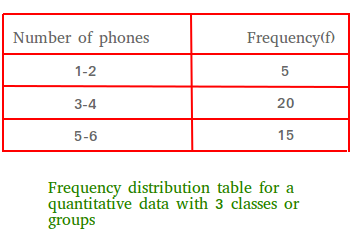
Pretend you want to organize the data using only 3 classes. As you can see in the table below, we now have intervals for those classes. The first interval is 1-2.
The only problem is that when you use intervals, we cannot get at least 5 classes for this set of data.
Again, the classes must be intervals. However, if it is hard to get at least 5 classes, it may be best to create a frequency distribution using only single-valued classes.
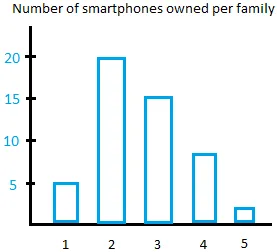
For single-valued classes, we can construct a bar graph to display the data.

Although we don't usually have frequency tables with just 3 classes, I will use the table below to give you some important definitions.

Lower class limits
1, 3, and 5 are called lower class limits.
Upper class limits
2, 4, and 6 are called upper class limits.
3-4 is called the second class. The upper limit of the third class is 6.
Class boundary
Class boundary is the midpoint between the upper class limit of one class and the lower class limit of the next class.
For example, the class boundaries of the second class are 2.5 and 4.5.
4.5 is the midpoint between 4 and 5.
2.5 is the midpoint between 2 and 3.
We write 2.5 to less than 4.5
We call 2.5 the lower boundary and 4.5 the upper boundary.
Class width
Class width = Upper boundary - Lower boundary
For this example, class width = 4.5 - 2.5 = 2.
Make sure you see the difference between upper boundary and upper limit. By the same token don't mix the lower limit with the lower boundary.
Class midpoint
The class midpoint, also called mark, is found by using the following formula.
In the next lesson, we will outline the steps for constructing a frequency distribution table using intervals only for the classes.