What is a frequency distribution?
A frequency distribution, also called frequency table, can be used to organize qualitative and quantitative raw data. A table is used to organize the data.
The information usually shows the frequency or the number of times each item shows up.
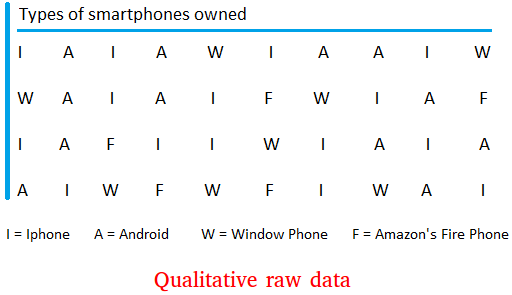
In the previous lesson, we showed raw data on the type of smartphone owned per family.
As you can see in the raw data, there are 4 groups or categories. These are Iphone, Android, Window phone, and Amazon's Fire phone.

A frequency distribution table could organize the information as shown below.
- Number of people who own an Iphone
- Number of people who own an Android
- Number of people who own an Amazon's fire phone
- Number of people who own a Window phone
The frequency table for a qualitative data shows all categories and the number times each category occurs.
How to make a frequency distribution table
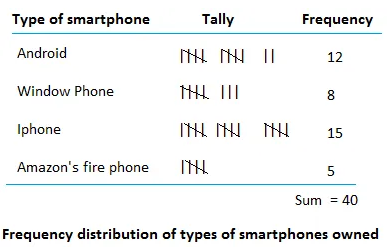
All you need to do now is to count the frequency of each category using tally marks.
Procedure:
Pick a category. Every time you see an occurrence of this category, make a tally mark.
For convenience, the tally are marked in block of 5.
Using tally marks, here is frequency table for the data given above.

Some important things to notice or keep in mind about the frequency distribution
Notice that the variable is the type of smartphone and it is a qualitative variable.
A category is one type of a smartphone. For example, Iphone is a category.
The categories are mutually exclusive. In other words, each person owns only one type of smartphone.
The frequency of Window phone is 8.
The letter f is used to represent the frequency.
There is a difference between frequency and frequency distribution.
The frequency will show the frequency of just one category.
The frequency distribution will show the frequency of all categories.