Graph equations in three dimensions
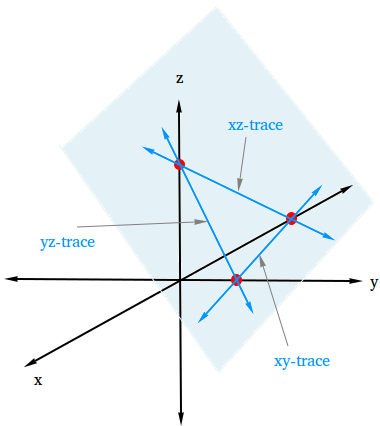
You can easily graph equations in three dimensions using the x-intercept, the y-intercept, and the z-intercept. The graph of an equation in two dimensions is a line. However, the graph of an equation in three dimension is a plane as shown below.

The intersection of two planes is a line. A trace is the line of intersection when one of the coordinate planes intersects the graph of a plane.
For example, when the coordinate plane xy intersects the graph of a plane, the line of intersection is called xy-trace.
How to graph equations in three dimensions
1. Find all three intercepts
2. Draw all three traces
3. Show the plane with shading
The best word to describe the graph of an equation in three dimensions is "sketch" because you cannot really show the entire. The triangle you see above extends indefinitely in all directions.
Example
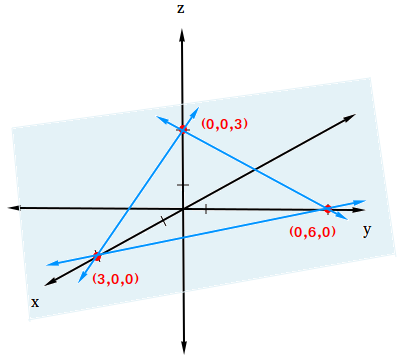
Sketch the graph of 3x + 2y + 4z = 12
Find the three intercepts.
To find the x-intercept, substitute 0 for y and z.
3x + 2y + 4z = 12
3x + 2(0) + 4(0) = 12
3x = 12
x = 4
To find the y-intercept, substitute 0 for x and z.
3(0) + 2y + 4(0) = 12
2y = 12
y = 6
To find the z-intercept, substitute 0 for x and y.
3(0) + 2(0) + 4z = 12
4z = 12
z = 3
Draw all three traces and show the plane with shading.
