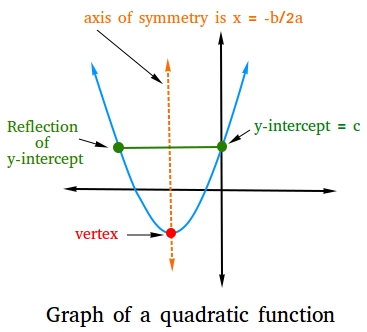
Graph of a quadratic function
The graph of a quadratic function is called a parabola. Consider the graph of y = ax2 + bx + c, where a is not equal 0.
- The equation of the axis of symmetry is x = -b/2a
- The x-coordinate of the vertex is -b/2a
- The y-intercept is c since y = c when x = 0
Notice that using the vertex, y-intercept, and the reflection of the y-intercept, we can roughly graph the quadratic function.
Then, you can always find and graph one or more additional points and their reflection.

A step-by-step example that shows how to find the graph of a quadratic function
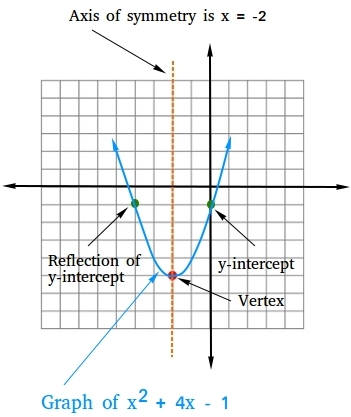
Graph x2 + 4x - 1
Step 1:
Identify a, b, and c by comparing ax2 + bx + c with x2 + 4x - 2.
a = 1, b = 4, and c = -1
Step 2:
Find the equation of the axis of symmetry.
x = -4/2 = -2
Step 3:
Find the x-coordinate and y-coordinate of the vertex.
Looking at the graph above, you can see that the vertex is located on the axis of symmetry. Therefore, the x-coordinate of the vertex is x = -2.
To get the y-coordinate, find f(-2)
f(-2) = (-2)2 + 4(-2) - 1 = 4 + -8 - 1 = -4 - 1 = -5
Step 4
Find the y-intercept and its reflection.
Since c = -1, the coordinate of the y-intercept is (0, -1).
The coordinate of the y-intercept is located on the right side of the axis of symmetry since 0 is bigger than -2. The y-intercept is 2 units away from the axis of symmetry.
Therefore, the reflection of the y-intercept is also 2 units away from the axis of symmetry. Since the y-intercept is located on the right side of the axis of symmetry, the reflection of the y-intercept is located on the left side of the axis of symmetry. Two units away from -2 and on the left side of -2 is -4, so the coordinate of the reflection of y-intercept is (-4, -1)
Step 5
Graph the vertex (-2, -5), the y-intercept (0,-1) and its reflection (-4,-1), and the axis of symmetry (x = -2). Find some additional points and their reflection and connect the points with a smooth curve.
