Graph of speed
Examining a graph of speed is a good way to understand speed and by the same token acceleration. The graph below is a graph of the speed versus time.
It is important to always put the time on the horizontal axis!
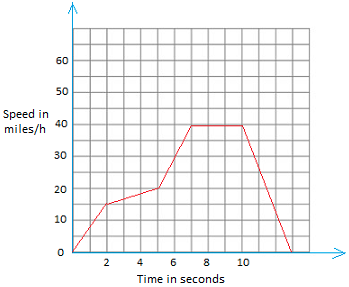
Let us examine the graph below by pretending that this is the speed of a car.
Just looking at the graph, it makes a lot of sense to say that the entire graph shows the speed, but not the velocity because the speed changes constantly.

The instantaneous speed at the 1-second mark is approximately 7.5 miles per hour.
The instantaneous speed at the 2-second mark is 15 miles per hour.
There is some acceleration going on there since the speed is increasing.
Moreover, it is a constant acceleration during the first 2 seconds since the speed increased by the same amount that is 7.5. (7.5 + 7.5 = 15)
a = 7.5 m/hour.s
Since the acceleration is constant during this time, it is possible to get the average speed of the car.
Recall that when the acceleration is constant and suppose the car was moving in a straight line, we can get the average speed the same way we get the average of two numbers.
The average speed is 7.5 miles per hour.
How far is the car at the end of the 2-second mark?
It is not an easy question since there is a lot of math involved here. This will not be covered here.
What is happening between the 2-second mark and the 5-second mark? The amount that the speed is increasing is less. It is because the line is less steep.
The car is not decelerating. The acceleration is just a little less.
Between the 5-second mark and the 7-second, the acceleration is more than previous time.
In 2 seconds, the car has gone from 20 miles per hour to 40 miles per hour. The speed is increasing by 10 miles per hour each second.
Between 7 and 10, the speed does not change. It is 40 miles per hour. This means that the car did not accelerate.
Now past the 10-second mark, the car decelerates until it comes to a complete stop.
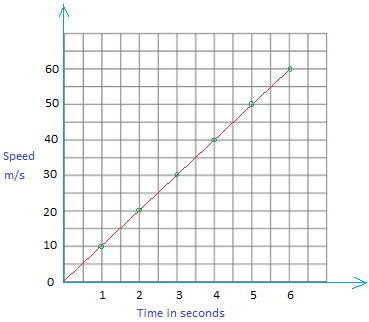
Graph of speed versus time for free fall

Here, you can see that every second, the speed increases by 10 meters per second each second.
a = 10 m/s2
The line is straight, so the acceleration is constant.