Graphing complex numbers
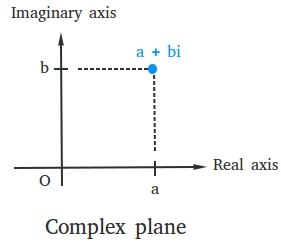
Graphing complex numbers in the complex plane or Argand diagram is similar to graphing points in the rectangular coordinate system. However, there is a difference.
Similarity: The complex number a + bi is represented as a point (a, b) in the complex plane and you can graph (a, b) the same way you graph it in the coordinate system.
Difference: In the rectangular coordinate system, the horizontal axis is called x-axis and the vertical axis is called y-axis. In the complex plane, the horizontal axis is called real axis and the vertical axis is called imaginary axis. The complex plane was developed by Jean-Robert Argand in 1806 while he pursued math most likely as a hobby.

When we represent a complex number geometrically as a point in a coordinate plane, we can also say that we are plotting the complex number.
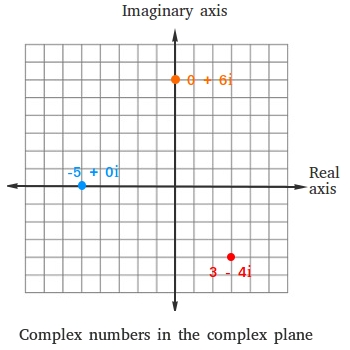
Graphing complex numbers on the complex plane. See some examples below:
Graph 3 - 4i, -5, and 6i on the complex number plane.
First notice that -5 = -5 + 0i and 6i = 0 + 6i
We plot 3 - 4i, -5 + 0i, and 0 + 6i the same way we plot (3, -4), (-5, 0), and (0, 6) in the rectangular coordinate system.
