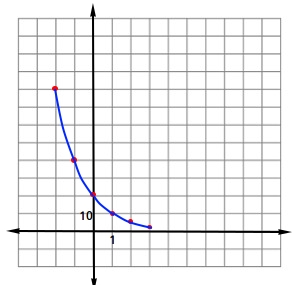
Graphing exponential decay
When graphing exponential decay, it is always a good idea to make a table of values and you could look for at least 5 points that you can use to make the graph. In the table below, we use 6 points.
It is also a good idea to choose both negative and positive values for x, especially numbers that are opposites. For example, notice how we chose x = -1 and x = 1.
| x | ||
| -2 | ||
| -1 | ||
| 0 | ||
| 1 | ||
| 2 | ||
| 3 |

Did you make the following observations about the figure above?
- Each square in vertical axis or y-axis represents 10 units.
- Each square in horizontal axis or x-axis represents 1 unit.
Important observations when graphing exponential decay
Now, let us see what will happen if we choose the following values for x:
x = -4, -10, -20
If x = -4, y = 20 × 0.5-4 = 20 / 0.54 = 20 / (1/2)4 = 20 / (1/16) = 20×16 = 320.
If x = -10, y = 20 × 0.5-10 = 20 / 0.510 = 20 / (1/2)10 = 20 / (1/1024) = 20×1024 = 20480.
If x = -20, y = 20 × 0.5-20 = 20 / 0.520 = 20 / (1/2)20 = 20 / (1/1048576) = 20×1048576 = 20971520.
When graphing exponential decay, as the values of x get smaller and smaller, the values of y get bigger and bigger. In other words, the values of y will approach infinity.
Now, let us see what will happen if we choose the following values for x:
x = 4, 10, 20
If x = 4, y = 20 × 0.54 = 20 × 0.0625 = 1.25
If x = 10, y = 20 × 0.510 = 20 × 0.0009765625 = 0.01953
If x = 20, y = 20 × 0.520 = 20 × 0.0000009537 = 0.000019074
As x increases, y decreases exponentially or decreases rapidly. The value of y get closer and closer to 0.