Graphing linear equations
Before graphing linear equations, make sure you understand the concepts of graphing slope since it is very similar.Follow the following guidelines to graph a linear equation:
Method 1
Step #1:
Put the y-intercept on the coordinate system.
Step #2:
Starting from the y-intercept, use the slope to locate one more point on the coordinate system.
Step #3:
Draw a line between the y-intercept and the other point.
Graphing linear equations using method 1.
Example #1:
Graph y = (4/3)x + 2
Step #1:
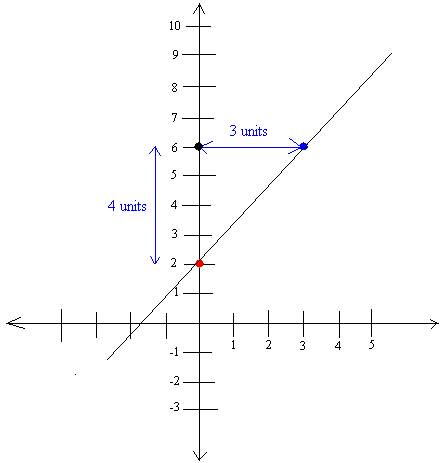
Here m = 4/3 and b = 2. Put 2 on the coordinate system. The graph is below and the y-intercept is shown with a red dot.
Step #2:
Starting from the 2, go up 4 units (you end up at 6, where the black dot is) and over 3 units (The new point is shown with a blue dot)
Notice that we move to the right. We always move to the right!
Step #3:
Draw a line between the red dot and the blue dot. See below:

Graph y = (-4/3)x + 2
Same problem with the exception that the slope is negative.
Step #1 stays the same.
In step #2, you go down 4 units instead of going up. We always go down when the slope is negative, but again we still move to the right.
In step #3, after you go down 4 units and move to the right 3 units, the point will be located at (3, -4)
Draw a line between that point and the red dot.
Example #3:
Graph y = x − 2
Rewrite the equation as y = 1x + -2
Here m = 1 and b = -2. Repeat step #1 through #3
Graphing linear equations using method 2 shown below.
Method 2
Method 2 consists of looking for points, at least 2 or 3, plotting them, and drawing a straight line between them.
It is common practice to look for the y-intercept, x-intercept, and any other point by letting x be anything and solve for y.
Example #4:
Graph y = 2x + -4
y-intercept:
When x = 0, y = 2 × 0 + -4 = 0 + -4 = -4 (Notice that x is always zero when a point is on the y-axis)
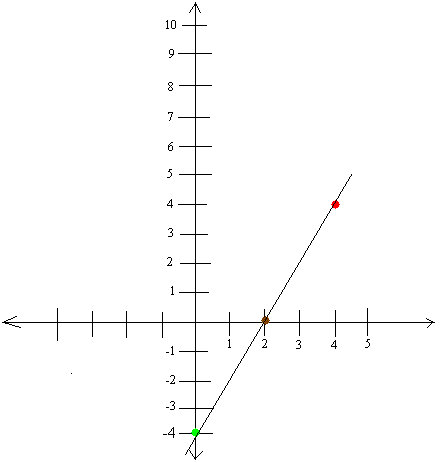
The point is (0, -4) shown with a green dot.
x-intercept:
When y = 0, 0 = 2x + -4 (Notice that y is always zero when a point is on the x-axis and x-intercept is a point on the x-axis)
So 0 = 2x + -4
0 + 4 = 2x + -4 + 4
4 = 2x
4/2 = (2/2)x
2 = x
The point is (2, 0) shown with a brown dot.
At this point, you could make the graph with these 2 points when graphing linear equations, but it will not hurt to get one more.
So as we said, let x be anything, say 4, then y = 2 × 4 + -4 = 8 + -4 = 4
The third point is (4, 4) shown in red. The graph is shown below.
