Graphing Linear Inequalities
Learn to Graph Linear Inequalities
Current Inequality: y > 2x + 1
How to Graph the Line:
- Start at y-intercept: ●
-
Use the slope to find a second point:
2
1
● Go unit(s)● Go unit(s)
- Connect the points with a line
Understanding the Test Point Method:
- Pick test point (0,0) - it's the easiest to use!
- Plug (0,0) into the inequality:
- If TRUE: Shade the side containing (0,0)
- If FALSE: Shade the opposite side
Before learning how to graph linear inequalities, make sure you understand the concepts of graphing slope and graphing linear equations since it is very similar.
Follow these Guidelines when Graphing Linear Inequalities:
The standard form of a linear inequality is y > mx + b , y < mx + b , y ≤ mx + b , or y ≥ mx + b.
Say you are graphing y > mx + b
- First graph, y = mx + b.
- Then, find out if y is bigger above the line or beneath the line.
- Finally, shade the area where y is bigger than mx + b.
Example:
graph y > (2/3)x + 1
First, graph y = (2/3)x + 1
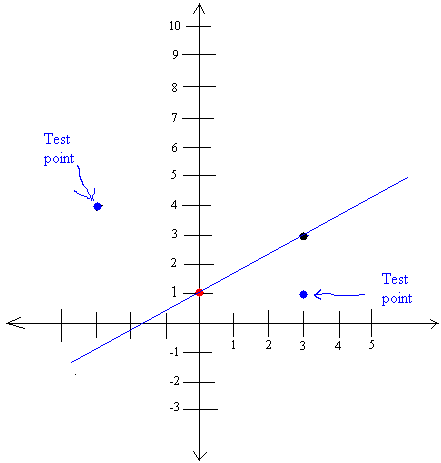
1 is the y-intercept and always goes on the y-axis as shown in the graph below with a red dot.
The slope is m = 2/3. 2 is the rise or how many units you go straight up. 3 is the run or many units you go to the right. (always to the right)
So starting from 1, go up 2 and over 3. This is shown again in the same graph. The location of the new point is shown with a black dot.
Draw a line between the red dot and the black dot. The line is shown in blue.
Now here is the crucial step:
To know which side you shade, you need to pick a point on one side, plug the point into the inequality and see if the resulting inequality makes sense.
If it makes sense for one point, it will make sense for any point you pick on that side. Thus shade everything on the same side of that point.
We will test two points (shown with blue dots). One point will make sense when replaced into the inequality. The other will not.
Let's test (-3, 4)

y > (2/3)x + 1
Is 4 > (2/3)× -3 + 1 ?
Is 4 > (2/3)× -3/1 + 1 ?
Is 4 > (2 × -3)/(3 × 1)?
Is 4 > -6/3 + 1 ?
Is 4 > -2 + 1 ?
Is 4 > -1 ?
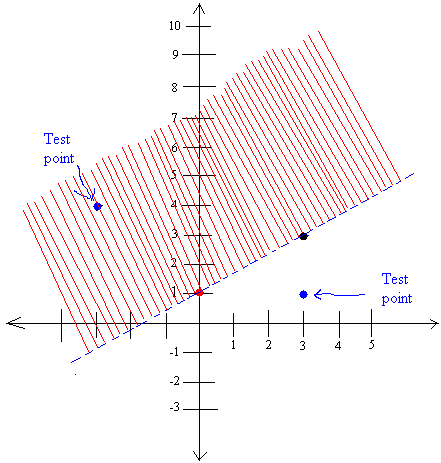
Since the inequality makes sense for (-3, 4), it will make sense for any point chosen on that side or above the line. Therefore, shade everything on the same side of (-3, 4).
Since y is bigger than (2/3)x + 1, but never equal to the line y = (2/3)x + 1, we cannot take any point on the line y = (2/3)x + 1. We show this situation with dashed line.
The shaded area representing the location where you can choose any point that will work is shown below in red.

Notice that the point (3,1) will not make sense when replaced into the inequality.
y > (2/3)x + 1
Is 1 > (2/3)× 3 + 1 ?
Is 1 > (2/3)× 3/1 + 1 ?
Is 1 > (2 × 3)/(3 × 1)?
Is 1 > 6/3 + 1 ?
Is 1 > 2 + 1 ?
Is 1 > 3 ?
Since 1 is not bigger than 3, it will not make sense for any point chosen on the same side of the point (1 3) or chosen below the line.
If you were graphing y ≥ (2/3)x + 1, everything stays the same, but you will not make a dashed line. Instead the line will be continuous.
Graphing linear inequalities is straightforward once you know how to graph the line. The tricky thing when graphing linear inequalities is to find out if we shade above or below.