Less than method for writing classes
The less than method for writing classes is used for data sets that contain fractional values or continuous variables such as the ones in table 1.
We will construct a frequency table and then calculate the relative frequencies and the percentage for all classes.
Choose 5 as the number of classes.

The class width can be approximately 3. We can use 1 as the lower limit of the first class.
The upper limit of the first class has to be 4
1-4
4-7
7-10
10-13
13-16
Important thing to keep in mind when using the less than method for writing classes
Notice that the upper limit of one class is also the lower limit of the next class.
This is different from the way we did it for discrete variables. For discrete variables, your classes will look more like option #1.
However, option #1 does not include values between 3 and 4 such as 3.4
Therefore, the upper limit of one class has to be the lower limit of the next class to make sure that all values are included.
Option #2 includes all values. However, it has 7 classes as opposed to 5.
Option #1
1-3
4-6
7-9
10-12
13-15
Option #2
1-3
3-5
5-7
7-9
9-11
11-13
13-15
The proper way to write the classes though is like this.
1 to less than 4
4 to less than 7
7 to less than 10
10 to less than 13
13 to less than 16
To find the frequency of the first class, just count how many numbers are between 1 and 4 starting with 1 and ending with a number less than 4
To find the frequency of the second class, just count how many numbers are between 4 and 7 starting with 4 and ending with a number less than 7
And so forth.
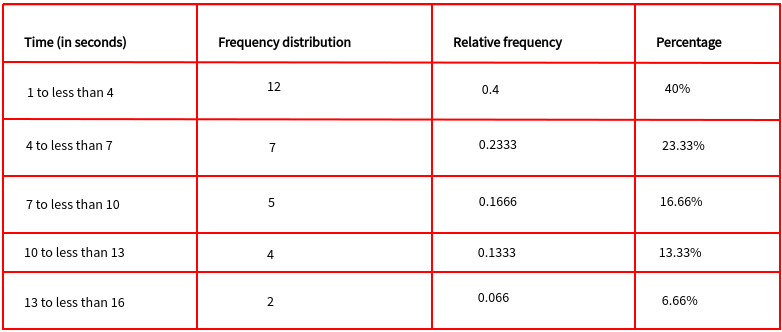
The frequency table is shown below along with the relative frequency and the percentage.

To calculate the relative frequency of the first class, just divide 12 by 30.
To Find the percentage of the first class, just multiply the relative frequency by 100
To calculate the relative frequency of the second class, just divide 7 by 30.
To Find the percentage of the second class, just multiply the relative frequency by 100
and so forth.