Marginal probability
To explain what marginal probability is, we need a contingency table. A contingency table is a table in which we show frequency for 2 variables.
One variable is used to categorize rows and the other is used to categorize columns.
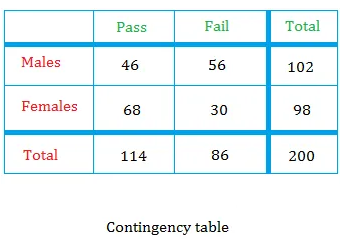
Suppose a company specializes in training students to pass the GED test. The company had 200 students last year.
The following contingency table show their pass rates broken down by sex.

In the table above, the variable that categorizes rows is the sex. This variable can be males or females.
The variable that categorizes columns is the result. This variable can be pass or fail.
Did you notice the followings?
- The number of males + females = 102 + 98 = 200
- The number of students who passed + the number of students who failed = 114 + 86 = 200
- The number of females who failed the GED test is equal to 30
Now that you understand what a contingency table is, what is marginal probability ?
In the table above, there are 4 events.
- A student is a male
- A student is a female
- A student has passed
- A student has failed
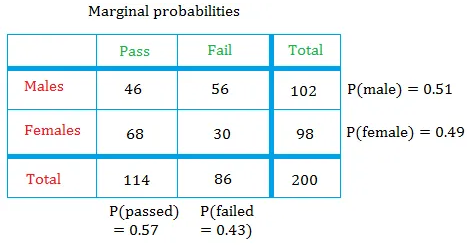
The probability of each of these 4 events is called marginal probability or simple probability
The 4 marginal probabilities can be calculated as follows
The marginal probabilities are shown along the right side and along the bottom of the table below.
