Mean from a Frequency Table
You can find the mean from a frequency table when you don't know the exact values in the classes.
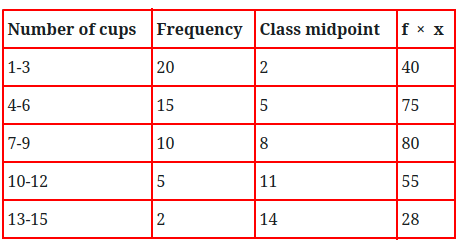
Suppose somebody conducted a survey to find out the number of cups of water drank daily by people. The person who conducted the survey interviewed 52 people and he gave you this frequency table in order to find the mean.
Since you don't know the values in the classes, you can pretend that each value in a class is estimated by the class midpoint.
For example, the possible values in the class 4-6 are 4, 5 , and 6.
Since you have no idea how many times 4, 5, or 6 occurs in that class, you will just use the class midpoint or 5.

Notice that the frequency of this class is 15. This means that the "pretend" raw data for the class 4-6 is
5 5 5 5 5
5 5 5 5 5
5 5 5 5 5
The " pretend " raw data for the class 1-3 is
2 2 2 2 2 2 2 2 2 2
2 2 2 2 2 2 2 2 2 2
The " pretend " raw data for the class 7-9 is
8 8 8 8 8
8 8 8 8 8
The " pretend " raw data for the class 10-12 is
11 11 11 11 11
The " pretend " raw data for the class 13-15 is
14 14
There are 52 numbers from these 5 classes.
To find the mean, you need to add these 52 numbers and divide by 52.
Instead of adding 52 numbers together, there is an easier way
You could do 15 × 5 + 20 × 2 + 10 × 8 + 5 × 11 + 2 × 14
The math above is found by multiplying the frequency and the class midpoint and then adding the sums.
Formula to use to get the mean from a frequency table
If f represents the frequencies and x represents the midpoints, the math can be expressed as Σ f × x
To get 52, you need to add the frequencies together. This can be expressed as Σ f
To get the mean from a frequency table, use formula below:
Using our table above, we can compute the mean s shown below:
Mean = 5.346
Therefore, we can conclude that people drink an average of 5.346 cups of water daily.