Normal probability distribution
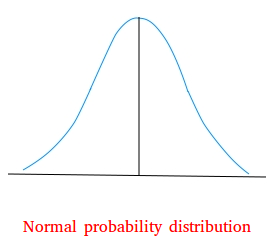
The normal probability distribution, also called normal curve, is a special type of bell-shaped curve like the one you see here.

A continuous random variable is normally distributed either exactly or approximately. For example, scores on examination and heights of people are normally distributed.
Characteristics of a normal probability distribution
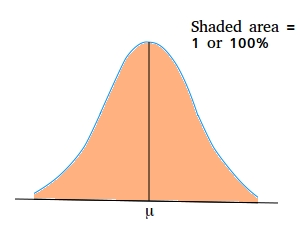
a. The total area under the curve is 1.

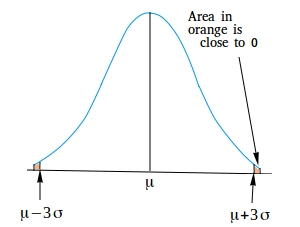
b. The tails of a normal distribution curve extend indefinitely in both directions without crossing or touching the horizontal axis.

µ + 3σ means three standard deviation above the mean
µ - 3σ means three standard deviation below the mean
Beyond the points µ - 3σ and µ + 3σ is where you see the tiny area with the orange color. These areas are close to zero.
In general, all possible observations of the variable lie within three standard deviation to either side of the mean since passed µ - 3σ and µ + 3σ, the values are close to zero.
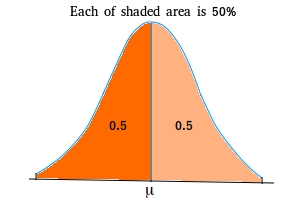
c. The normal curve is symmetric about the mean.

In practice, it is not likely that a distribution will have exactly the shape of a normal curve. It is more common to find distributions that are shaped roughly like a normal curve.