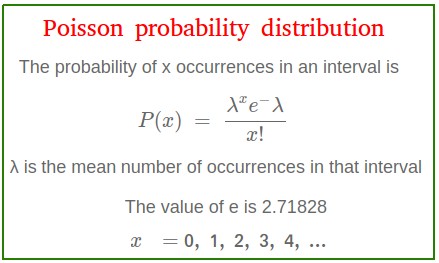
Poisson probability distribution
The Poisson probability distribution is a discrete probability distribution named after the French mathematician Simeon D. Poisson.

A real life example where we can use the Poisson probability distribution
Example:
Suppose there is a power outage in an apartment complex 3 times a year. You may want to find the probability that there will be exactly 2 power outage next year. This is an example of a Poisson distribution problem.
In our example above we could extract the following:
- The mean number of occurrences is λ = 3
- You may be interested to find P(2) when x = 2
Each power outage is called an occurrence. In order to use the Poisson probability distribution, the occurrence must be independent and random.
The power outage is independent. The next power outage does not depend on the one before. In other words, once a power outage has occurred, the next one is not influenced by any power outage that happened before.
Each power outage is also random. In other words, they do not follow any known pattern. There is no way to tell when a power outage will occur. They just happen randomly.
Occurrences always happen with respect to an interval as already mentioned in the formula. In our example of power outage, the interval in one year as opposed to being one month. This makes sense since we do not expect too many power outages unless we are living in a less developed country.
Once you know the average number of occurrences in an interval, we use the Poisson probability distribution to compute the probability of a certain number of occurrences ,x, in that interval.
More examples to which the Poisson probability distribution can be applied
- The number of patients arriving at the emergency room during a one-hour interval.
- The number of phone calls you will receive from telemarketers during a one-month interval.
- The number of vehicle accidents that occur on a given highway during a one-week interval.
- The number of defective items in the next 200 items produced by a machine.
Notice that the last example is an example of volume interval instead of time interval. The occurrences are the number of defective items. They are random since there could be 0, 1, ... , 100 defective items. These occurrences are independent since the occurrence of a defective item does not influence the occurrence of another.