Relationship between the mean, median, and mode
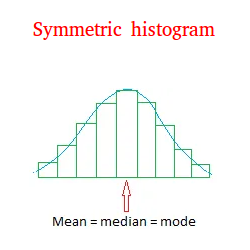
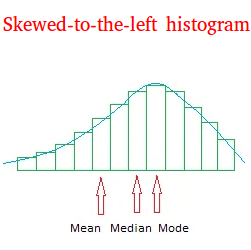
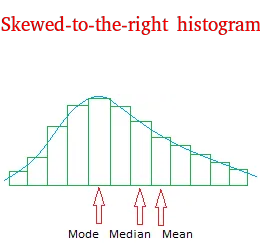
The relationship between the mean, median, and mode is shown with these 3 histograms below.
4 important observations after a close examination of the relationship between the mean, median, and, mode.
1. The mode always occurs where the frequency is the highest.


Consider the following classes along with their frequencies to see why this the case.
1-3 2
4-7 3
8-10 8
11-13 5
14-16 1
Now try to imagine what the raw data might be. There are many possibilities, but one of these possibilities could be what you see below.
2 3 4 7 5
8 9 10 8 9
10 8 9 11 11
13 12 13 14 15
16
As you can see, 9 (shown with dark blue) is a mode of this data set and it occurs for the class with a frequency of 8. The reason for this is simple.
Notice that each class can only have 3 values. Furthermore, since the frequency is 8, you must write 8 numbers (shown with light blue and dark blue).
Since you have to write 8 numbers, some numbers will have a tendency to repeat themselves.
2. For a symmetric histogram, mean = median = mode (at the very least, if they are not equal to one another, they will have values that are very close to one another)
Consider the classes along with their frequencies. This situation will give a symmetric histogram.
1-3 2
4-6 3
7-9 6
10-12 3
13-15 2
The raw data could be
1 2 4 5 6 7 8 9
7 8 9 10 11 12 13 14
The modes are 7, 8 and 9.
The mean is 7.875 and 7.875 is closely equal to 8
The median is 8
You could conclude that mean = median= mode = 8
A skewed-to-the-left histogram is also called negatively skewed histogram and a skewed-to-the-right histogram is also called positively skewed histogram.
3. Although it is not always predictable, for a skewed-to-the-left histogram, the mean is the smallest, the mode is the biggest, and the median is between the mean and the mode.
The mean is the smallest because outliers in the left tail will pull the mean to the left. Notice also that there are more values on the left tail than on the right tail.
These values including possible outliers will have a tendency to pull the mean to the left and make its value smaller than the other measures of center.
4. Although it is not always predictable, for a skewed-to-the-right histogram, the mean is the biggest, the mode is the smallest, and the median is between the mean and the mode.
The mean is the biggest because outliers in the right tail will pull the mean to the right. Notice again that there are more values on the right tail than on the left tail.
These values including possible outliers will have a tendency to pull the mean to the right and make its value bigger than the other measures of center.