What is relative frequency?
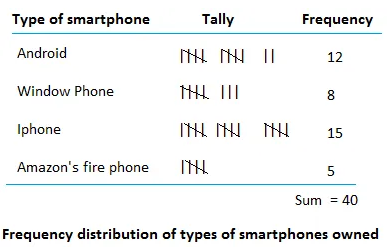
In order to find the relative frequency, we will use the frequency distribution table below and the following formula.
To find the relative frequency of a category, divide the frequency of that category by the sum of all frequencies.
We can express the relative frequency with a math formula.
The table below is a frequency table of type of smartphone. Let us find the relative frequency for the categories you see in the able above.

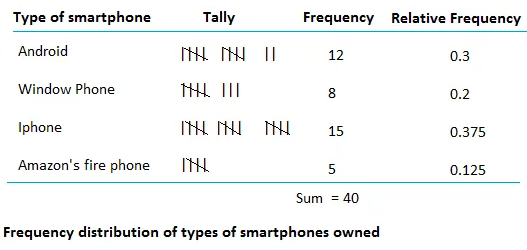
A relative frequency distribution is a table that shows the relative frequency for all categories as shown below.

Notice that the sum of the relative frequencies is always equal to 1.
The percentage of a category is found by multiplying the relative frequency of that category by 100.
Percentage of Android phone = 0.3 × 100 = 30%
Relative frequency of Window phone = 0.2 × = 20%
Relative frequency of Iphone = 0.375 × 100 = 37.5%
Relative frequency of Iphone = 0.125 × 100 = 12.5%
Since, the relative frequency of Window phone is 20%, we can conclude 20% of the people in the sample said that they own a Window phone.