Solve a polynomial equation by graphing
You can solve a polynomial equation by graphing each side of the equation separately on the same coordinate system. Then, to find the solution, just get the x-values at the point of intersection.
Example
Solve x3 + 3x2 = x + 3 by graphing
Step 1
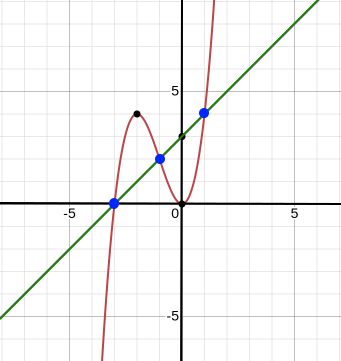
Use a graphing calculator to graph y1 = x3 + 3x2 and y2 = x + 3 on the same screen. A portion of the graph is shown below. y1 is the graph shown in red and y2 is the graph shown in green.

Step 2
You can use either the graph above to locate the points of intersection or you can use the intersect feature in your calculator to find the x-values at the points of intersection.
The points of intersection are shown on the graph above with blue dots. The x-values give the solution. Therefore, the solutions are -3, -1, and 1.
Check
Show that -3, -1, and 1 are indeed solutions by plugging each value in the original solution.
x = -3
x3 + 3x2 = x + 3
(-3)3 + 3(-3)2 = -3 + 3
-27 + 3(9) = 0
-27 + 27 = 0
0 = 0
x = -1
(-1)3 + 3(-1)2 = -1 + 3
(-1)3 + 3(-1)2 = -1 + 3
-1 + 3(1) = 2
-1 + 3 = 2
2 = 2
x = 1
x3 + 3x2 = x + 3
(1)3 + 3(1)2 = 1 + 3
1 + 3(1) = 4
1 + 3 = 4
4 = 4