Types of graphs
There are many types of graphs. In this lesson, you will learn about the most common types of graphs used in mathematics such as the ones that are listed below:
- Pictograph
- Bar graph
- Double bar graph
- Histogram
- Line graph
- Circle graph
- Scatter plot
What is a pictograph?
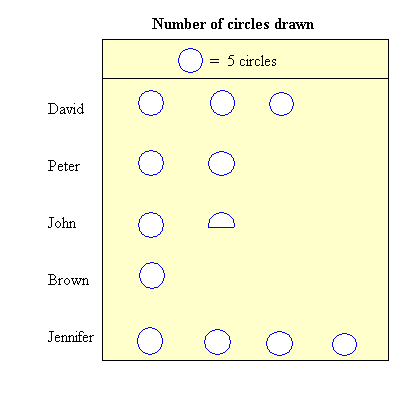
A pictograph is a graph that uses pictures or symbols to display information. The pictures in a pictograph usually represent more than one item. The following is a pictograph:
What is a bar graph?
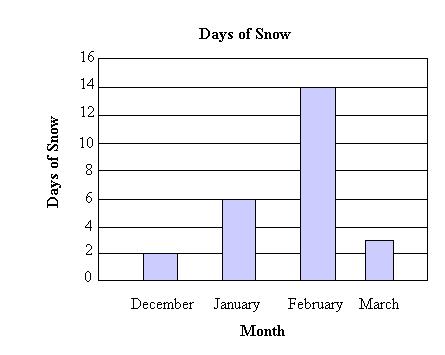
A bar graph can be used to compare data or values by using rectangular bars. A bar graph can either be vertical or horizontal. The bar graph below is a horizontal bar graph. In a horizontal bar graph, the horizontal axis shows the categories while the vertical axis shows the value of each category.
What is a double bar graph?
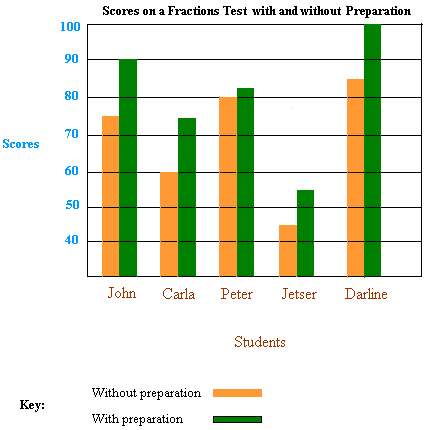
A double bar graph can help us compare more than one type of information. In the bar graph above, we are comparing just one type of information. It is the number of days of snow in a specific month. In the double bar graph below, we are comparing two types of information. We are comparing the score for a specific student with preparation and the score without preparation. Therefore, we need a double bar graph.
What is a histogram?
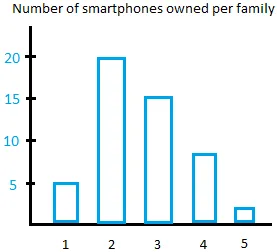
A histogram is a special type of bar graph that shows the frequency of numerical data instead of categorical data. And this is the main difference between a histogram and a bar graph. In the bar graph above, we are comparing categorical variables. For example, we are comparing the month of December with the month of January. However, in the histogram below, we are comparing numerical data. The graph shows that 20 families own 2 smartphones. However, only 5 families own 1 phone.
What is a line graph?
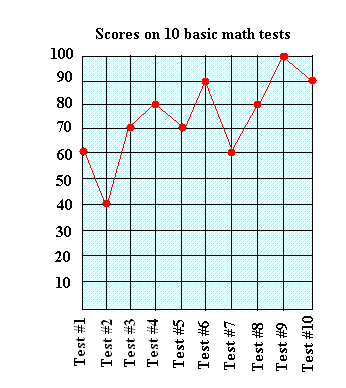
A line graph can be used to show the change in a set of data over a period of time. A line graph can help you better to look for trends and make predictions. In the line graph below, we see that the scores fluctuated greatly, but have increased as time goes by.
What is a circle graph?
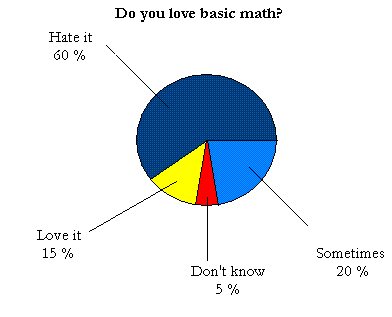
A circle graph is used to show data as percents or frations. The total is equal to 100% or 1.
What is a scatter plot?
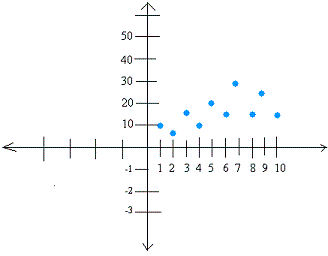
A scatter plot can be used to relate two groups of data. You plot the two groups of data as ordered pairs. Scatter plots can show if there is a correlation or relationship between the two groups of data. For example, for the ordered pair (4, 10), 4 could represent the number of hours you spend each day watching TV and 10 could represent in thousands your yearly income. There may or may not be a correlation between these two groups of data.
Importance of the different types of graphs
- Learning to read and create graphs are very useful skills in mathematics.
- Graphs help us to visualize data and the things that we see on the graph may help us to interpret and analyze the data.
- The end result is usually a better perspective that may not have been possible just by looking at a bunch of numbers.