Types of statistics
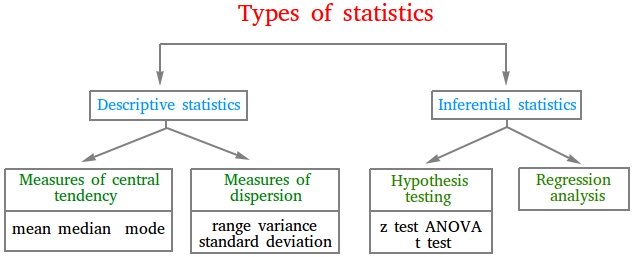
In applied statistics, the types of statistics can be divided into two areas: descriptive statistics and inferential statistics.

What is descriptive statistics?
Suppose you collect information on the number of students who graduate from high school before the age of 18 state by state in the United States. You will end up with lots of data.
Just having such a huge and unorganized amount of data is insignificant unless you can use it to draw conclusions or make important decisions.
The best way to create something useful and manageable with the data is to create tables, diagrams, or graphs that summarize the data. Once you have those tables, graphs, or diagrams that describe the data, it will be much easier to draw conclusions.
In descriptive statistics, you will also use the data to find measures of central tendency such as the average, the mode, or the median and measures of dispersion such as the range or the standard deviation. This is what descriptive statistics is about.
Summary and definition of descriptive statistics
Descriptive statistics consists of methods that are used to organize and display data into a manageable size with tables, graphs, and/or measures of central tendency and dispersion.
What is inferential statistics?
Suppose you want to find the salary of people who are at least 45 years old living in the United States. To do this, you may select people from all 50 states who are at least 45 years old and find their salaries.
The information will be summarized of course with a graph or a table.
If you are now younger than 45 years old and you are curious about your salary in the future, you can then analyze the graph and make an inference or educated guess. The graph may tell you what your salary may be like when you reach 45.
Hypothesis testing such as z test, t test, or ANOVA test can also be implemented in order to make an inference or test assumptions. Linear regression can also be used to model the data and then make predictions.
Summary and definition of inferential statistics
Inferential statistics consists of using the data that is collected in order to speculate on the future by using graph, hypothesis testing, and linear regression. Inferential statistics can also be called inductive statistics.
Types of statistics quiz
Types of statistics quiz will help you become familiar with the following words or expressions.
- Inferential Statistics
- Descriptive statistics
- Inference