Ways to represent domain and range
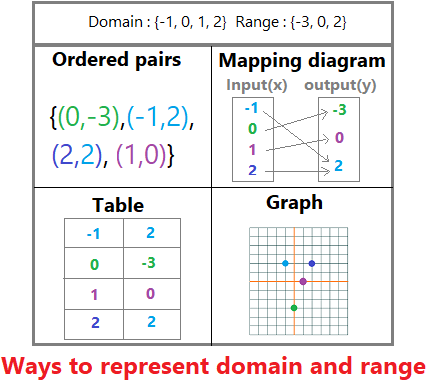
There are 4 different ways to represent domain and range. These are ordered pairs, mapping diagram, table, and graph.

Important observations about the different ways to represent domain and range
- In a table, put the x-values in increasing order or from least to greatest.
- In a mapping diagram, put both the x-values and the y-values in increasing order. Furthermore, do not repeat the number! For example, notice that 2 is listed as an output only once.
- When representing the domain and range as ordered pairs, there is no need to write the pairs in order.
- When writing the domain and the range, always list in numerical order.
- Finally, notice that we put the x-values in the domain on the left of the table and also on the left of the mapping table.