What is a pictograph?
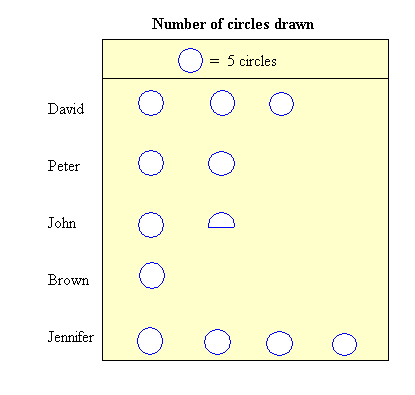
What is a pictograph? A graph is a visual way to display information. A pictograph is a special type of graph that uses pictures or symbols to display information. The pictures or symbols in a pictograph usually represent more than one item. The following is an example of a pictograph:

The pictograph above has a title and a scale.
- The title of this pictograph is "Number of circles drawn"
- The scale that the pictograph is using is this: One circle represents 5 circles.
Let us say that the circles were drawn by David, Peter, John, Brown, and Jennifer.
Having said that we can make the following observations:
- David drew 15 circles since we have 3 circles and each circle represents 5 circles (5 times 3 = 15).
- John drew 7.5 circles. How did we get 7.5?
- Jennifer drew 20 circles since we have 4 circles and each circle represents 5 circles (5 times 4 = 20).
How did we get 7.5 for John? Note that if a circle represents 5 circles, half a circle will represent 5/2 circles or 2.5 circles. Add 5 circles to 2.5 circles to get 7.5 circles.
An exercise that will show you how to construct a pictograph
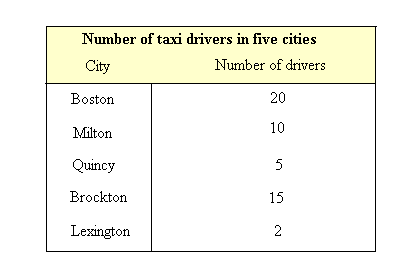
Construct a pictograph with the following table

You can follow this guideline in order to construct the pictograph.
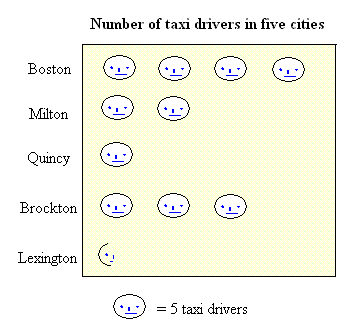
- For this pictograph, we can draw faces to represent the drivers.
- We can still use the same title "Number of taxi drivers in five cities"
- Since we are really dealing with very big numbers here, we can just use 1 face to represent 5 taxi drivers.
Suppose for instance, you were dealing with very big numbers such as hundreds of drivers in a city, you could have used 1 face to represent 100 drivers.
Here is the pictograph.
